10 years glance
>>
Income
(Rs. in Lakhs)
| Particulars | 2014-15 | 2013-14 | 2012-13 | 2011-12 | 2010-11 | 2009-10 | 2008-09 | 2007-08 | 2006-07 | 2005-06 |
|---|---|---|---|---|---|---|---|---|---|---|
| Turnover | 7854.77 | 4635.25 | 3711.28 | 10182.28 | 1741.25 | 5223.42 | 6307.50 | 2655.60 | 2245.81 | 2023.00 |
| Other Income | 331.70 | 353.60 | 466.05 | 534.95 | 767.79 | 292.30 | 131.69 | 171.84 | 134.83 | 67.51 |
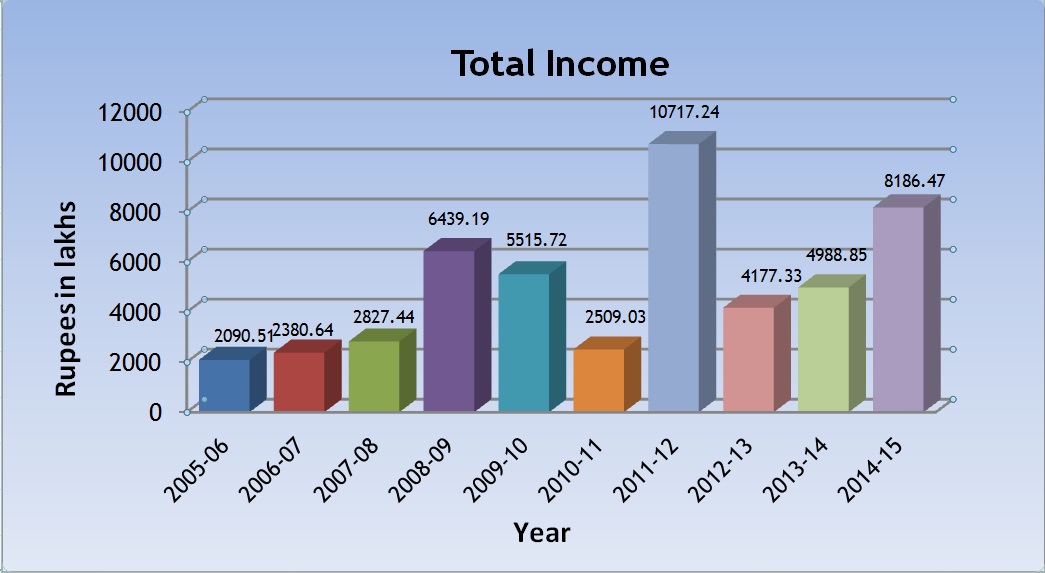
| Total Income | 8186.47 | 4988.85 | 4177.33 | 10717.23 | 2509.03 | 5515.72 | 6439.19 | 2827.44 | 2380.64 | 2090.51 |
| Earnings before Depreciation, Interest and Tax (EBDIT) | 2420.00 | 415.74 | 922.60 | 4224.57 | -75.84 | 2072.56 | 2365.33 | 1353.67 | 1080.51 | 1071.23 |
| Depreciation | 225.05 | 156.96 | 184.01 | 92.40 | 91.41 | 58.88 | 52.17 | 30.03 | 24.47 | 17.80 |
| Finance Costs | 213.35 | 247.54 | 183.93 | 190.12 | 126.23 | 39.65 | 115.13 | 58.22 | 51.74 | 28.13 |
| Provision for Taxation (Including Deferred Tax & FBT) | 407.68 | 1.91 | 84.58 | 780.48 | -85.90 | 289.81 | 341.26 | 167.89 | 285.79 | 308.91 |
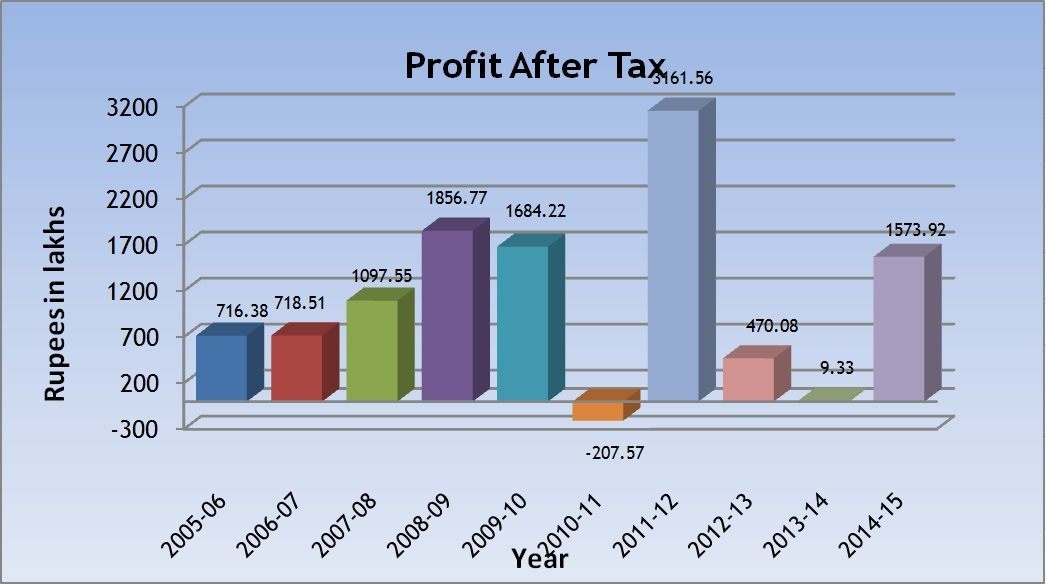
| Profit/(Loss) after Tax | 1573.92 | 9.33 | 470.08 | 3161.57 | -207.58 | 1684.22 | 1856.77 | 1097.55 | 718.51 | 716.38 |
| Cash Profit/(Loss) | 2206.65 | 166.29 | 654.09 | 3253.97 | -116.17 | 1743.10 | 1908.94 | 1129.41 | 744.82 | 736.02 |
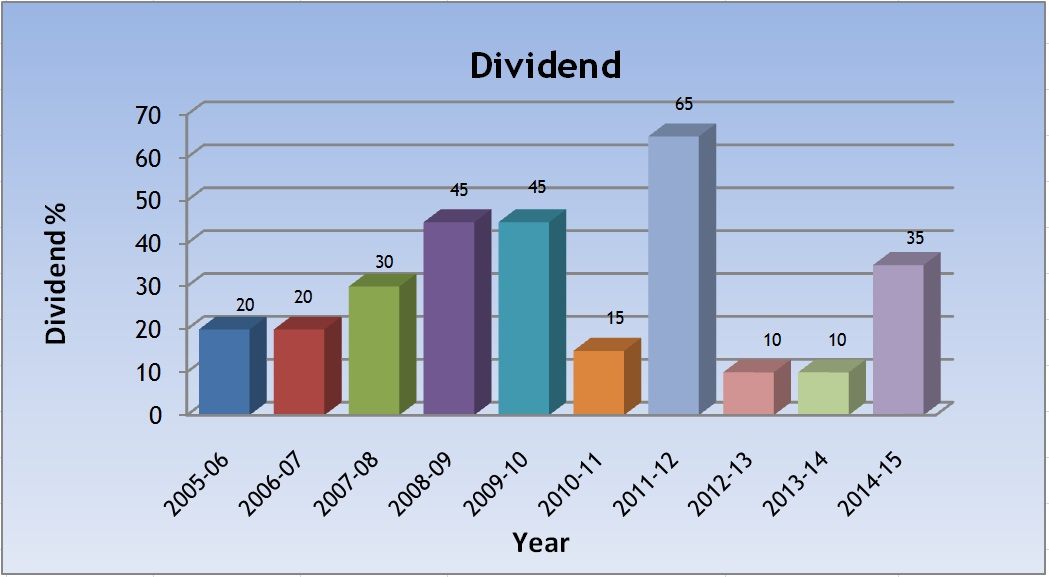
| Equity Dividend (%) | 35% | 10% | 10% | 65% | 15% | 45% | 45% | 30% | 20% | 20% |
| Dividend | 270.06 | 77.16 | 77.40 | 577.74 | 133.33 | 399.98 | 384.93 | 243.12 | 152.79 | 152.60 |
| Dividend Tax | 54.98 | 13.11 | 13.15 | 93.72 | 21.63 | 66.44 | 65.42 | 41.32 | 25.97 | 21.40 |
| Equity Share Capital | 771.60 | 771.60 | 888.84 | 888.84 | 888.84 | 888.84 | 855.40 | 810.40 | 763.96 | 763.00 |
| Reserves and Surplus | 10333.38 | 9084.50 | 9843.20 | 9477.11 | 6987.03 | 7349.56 | 5709.47 | 3740.55 | 2344.40 | 1804.65 |
| Networth | 11104.98 | 9856.10 | 10732.04 | 10365.95 | 7875.87 | 8238.40 | 6564.87 | 4550.95 | 3108.36 | 2567.65 |
| Gross Fixed Assets | 6239.24 | 6385.07 | 4112.63 | 3614.73 | 4227.44 | 3757.49 | 3280.57 | 1711.96 | 1288.55 | 803.21 |
| Net Fixed Assets | 6014.19 | 6228.11 | 3928.62 | 3522.33 | 3662.29 | 3293.25 | 2902.55 | 1416.18 | 1037.89 | 603.27 |
Key Performance Indicators
| 2014-15 | 2013-14 | 2012-13 | 2011-12 | 2010-11 | 2009-10 | 2008-09 | 2007-08 | 2006-07 | 2005-06 | |
|---|---|---|---|---|---|---|---|---|---|---|
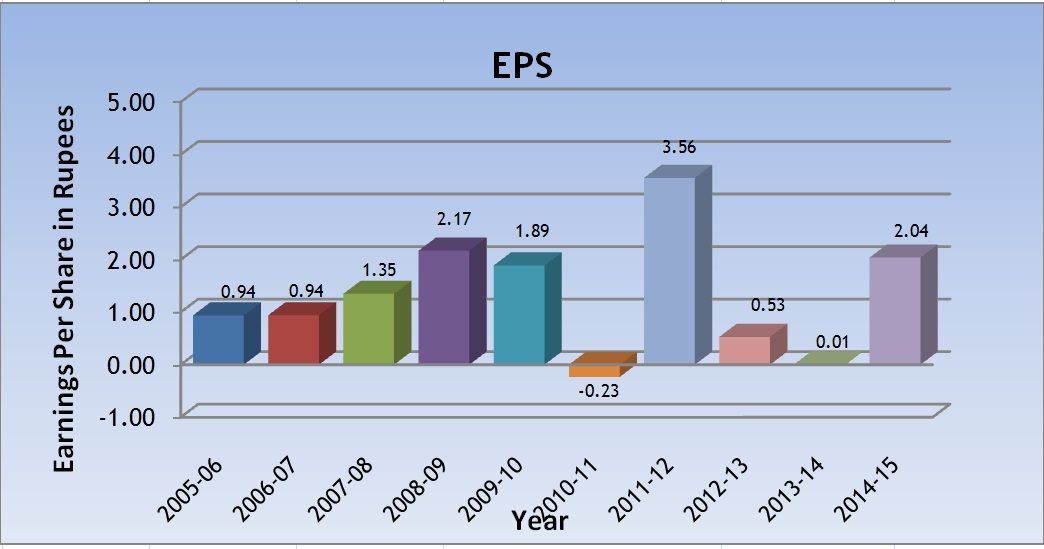
| Earnings per share - Rs. | 2.04 | 0.01 | 0.53 | 3.56 | -0.23 | 1.89 | 2.17 | 1.35 | 0.94 | 0.94 |
| Cash Earnings per share - Rs. | 2.86 | 0.22 | 0.74 | 3.66 | -0.13 | 1.96 | 2.23 | 1.39 | 0.97 | 0.96 |
| Book Value per share - Rs. | 14.39 | 12.77 | 12.07 | 11.66 | 8.86 | 9.27 | 7.67 | 5.62 | 4.07 | 3.37 |
| Debt : Equity Ratio | 0.35:1 | 0.17:1 | 0.11:1 | 0.23:1 | 0.17:1 | 0.20:1 | 0.18:1 | 0.22:1 | 0.32:1 | 0.14:1 |
| EBDIT / Turnover % | 30.81% | 8.97% | 24.86% | 41.49% | -4.36% | 39.68% | 37.50% | 50.97% | 48.11% | 52.95% |
| Return on Networth % | 14.17% | 0.09% | 4.38% | 30.50% | -2.64% | 20.44% | 28.28% | 24.12% | 23.12% | 27.90% |
*During the financial year 2014-15, the Company sub-divided each Equity Share of face value of Rs 10/- (Rupees Ten only) as existing on the Record Date (24 November 2014) into 10 (Ten) Equity Shares of face value of Rs 1/- (Rupee One only), each fully paid-up, with effect from the Record Date. Accordingly, per share information reflect the effect of subdivision retrospectively for the earlier reporting periods.