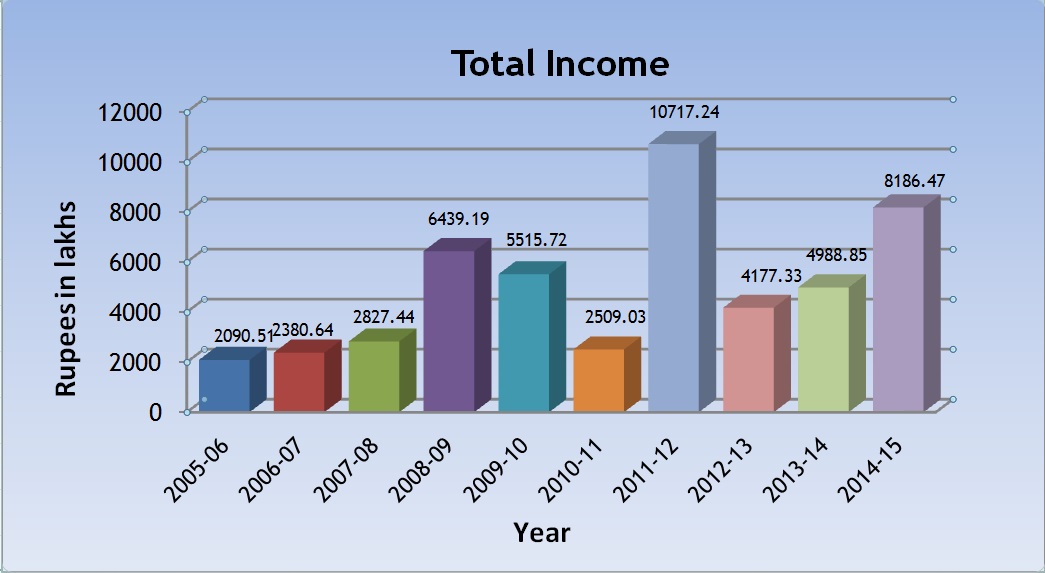
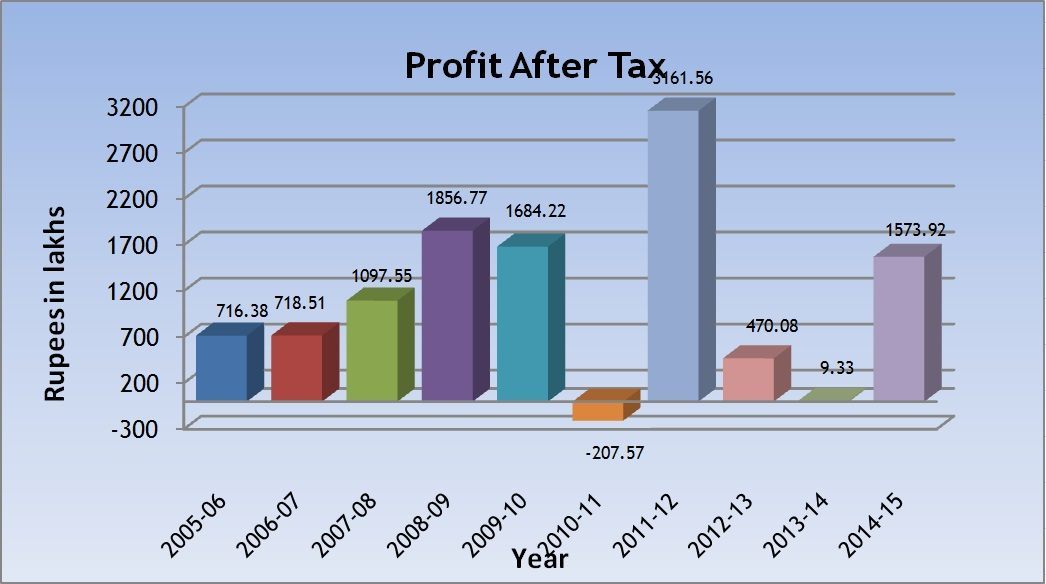
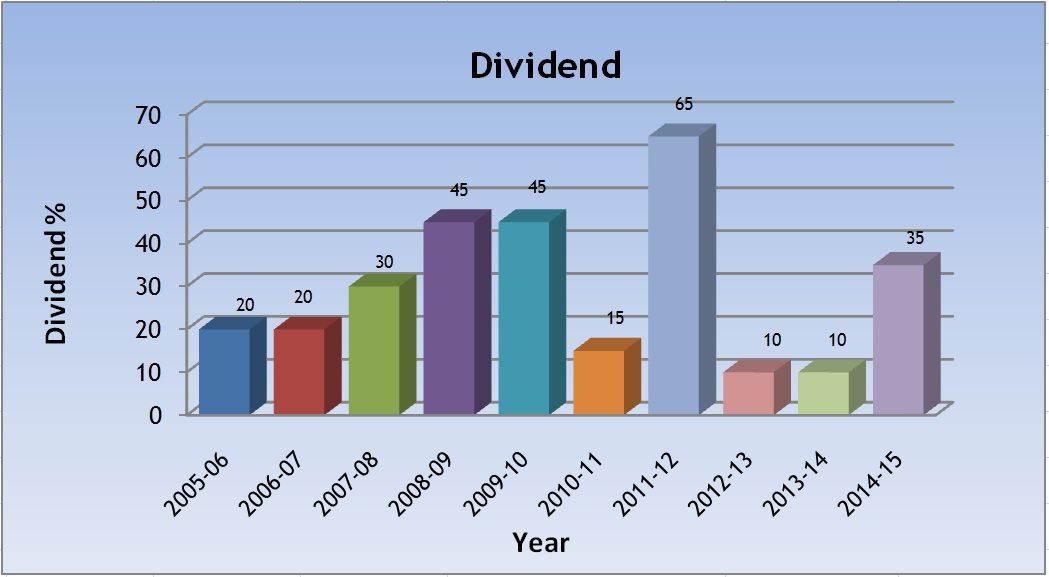
10 Years at a glance charts
Click the image for bigger resolution
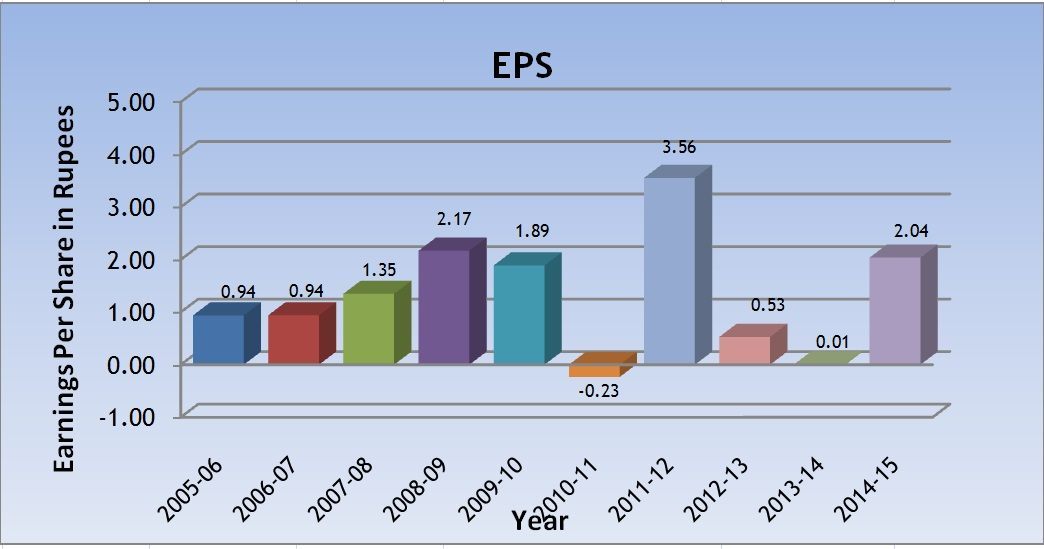
During the financial year 2014-15, the Company sub-divided each Equity Share of face value of Rs 10/- (Rupees Ten only) as existing on the Record Date (24 November 2014) into 10 (Ten) Equity Shares of face value of Rs 1/- (Rupee One only), each fully paid-up, with effect from the Record Date. Accordingly, per share information reflect the effect of subdivision retrospectively for the earlier reporting periods.
×
![]()